

Following https://tarte.nuage-libre.fr/c/fediverse/p/194717/we-need-more-users I decided to explore data a little bit more. I’m not the biggest fan of growth-as-as-target so I wanted to see how much the people were participating in the discussion.
The data
I took the data from the API explorer in https://api.fediverse.observer/ with this query:
query {
  monthlystats {
    date_checked
    softwarename
    total_posts
    total_users
    total_comments
  }
}
Then parsed the json with this https://jqlang.org/ filter:
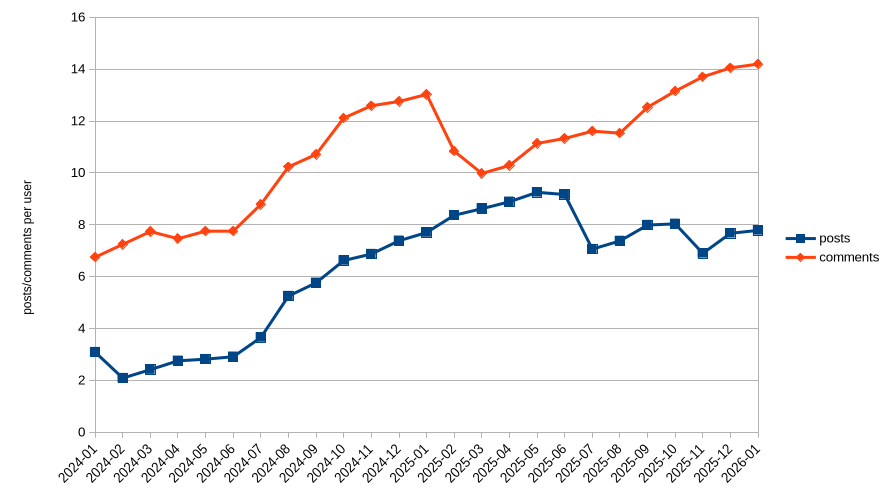
jq '.data.monthlystats | map(select(.total_users > 0 and (.softwarename == "lemmy" or .softwarename == "mbin" or .softwarename == "kbin" or .softwarename == "piefed"))) | group_by(.date_checked) | map( {date_checked: .[0].date_checked, total_users: ([.[] | .total_users] | add), total_posts: ([.[] | .total_posts] | add), total_comments: ([.[] | .total_comments] | add)}) | map({date_checked, posts: .total_posts/.total_users, comments: .total_comments/.total_users}) | sort_by(.date_checked) | map([.date_checked, (.posts | tostring), (.comments | tostring)]) | .[] | @csv'
(As you see I filtered for the threadiverse. I also did the same with all software, I’ll put the graph for that in comments)
Then did a good old’ chart
What to think of it
I don’t know. Users’ activity is on the rise and I find it nice
I’m kinda bummed more people from Reddit didn’t come here after the exodus. But I guess it’s a Catch-22 thing cause that could’ve been all kinds of good or all kinds of bad so who knows so he’s starting off fresh and slow. It’s kind of the best way to go maybe
a lot of people who came here are the insufferable types from reddit who think it’s their ‘duty’ to harass and shit on anyone who dares hold a different view of the world than they do, or who is more open minded than ‘anyone i don’t like is a nazi’.